DS-Crowd – A Short Tutorial
Introduction
DS-Crowd (Disaster-Scene Crowdsourcing) is a cloud-based Mobile Application that harnesses the intelligence of the ‘crowd’, who can be first-responders, professional inspectors, and the general public within or outside the disaster zone, to analyze and interpret disaster-scene data. Disaster scenes form extreme disasters, such as hurricanes, storms, surges, earthquakes, tsunamis, and tornadoes, are extremely complex. In the meantime, disaster scenes are perishable due to organized recovery efforts. Therefore, rapid post-disaster reconnaissance efforts are imperative in order to learn from disasters important knowledge, such as hazard effects, damage mechanisms, and vulnerabilities of built environments. Post-disaster reconnaissance technologies are many, ranging from sophisticate equipment based (e.g. use of Lidar or in-situ sensors) to the most commonly used ones — visual inspection aided by digital imaging.
On the other hand, we foresee and realize that the use of these technologies will result in flood of, if not ocean, of disaster scene data, mostly imagery data, which will further burden the decision-makers in justifying the optimal route for disaster response.
The DS-Crowd smart app is designed to enhance disaster scene understanding through a crowd-based computing aided by machine-based mobile and cloud computing. The direct deliverable is GIS-enabled semantic description of structural damage for individual built objects that are captured in images. The following presents a brief tutorial for the analytic framework and the front-end design.
Main Function of DS-Crowd
The current implementation aims to create structured information for disaster-induced damage. Given the images below, one can see that complex natural scenes besides distinct damage patterns are found in the images.
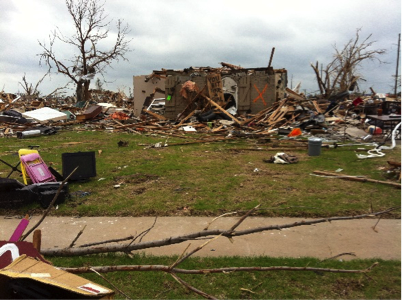
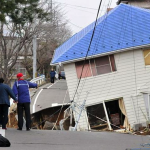
Figure 1. Complex disaster scenes: (a) a tornado disaster damage with debris, road, vegetation, and the damaged building; and (b) an earthquake disaster image wave destroyed road surface and inclined building in an urban environment background.
In general, there is no automated (i.e. computer-based machine vision or learning-based ) solution to date that can analyze such complex damage scene images automatically. Visual (human-based) inspection is the general approach to characterize the damage information embedded in the natural scene.
For any disaster scene image, we propose that the following generic contextual attributes (CA) that are essential to characterize the potential damage or effects for an object in an image: type of, location of, and degree of damage/effect to the object. Given an image with N objects, the values of the CAs and the original image form a disaster scene metadata (or DSM, a superset):
DSM = {the original image with objects of interest (Object 1 to Object N); {Type of Object n; Location of Object n; Degree of Damage/Effect of Object n| n = 1, N}}
If these attributes are assigned with meaningful values given one image and this process is conducted for many images (e.g. using a crowdsourcing approach), a disaster-scene knowledge database is expected to be generated given the original imagery-only database. The document-based MongoDB has been chosen to accommodate the above DSM structure in order to create a disaster-scene knowledge database.
For assigning values to these CA’s, a crowdsourcing approach can potentially provide the most rapid and reliable solution. Again, this is because that no matured artificial intelligence-based approach exists today for performing this analysis automatically.
Particularly, for the ‘Type of Object’, the following values are chosen: building, bridge, road, human, vehicle, and vegetation. Human, vehicle and vegetation are added because the damage to (or effects on) these objects also reflect the hazard intensity and severity of the disaster. This assigning process is through a simple multi-choice selection design in the DS-Crowd.
For ‘Location of Object’, this location is relative to the imagery domain. The location of the object is obtained through an interactive manipulation of an elastic contour (e.g a rectangle or ellipse) in the image domain. It is noted that this is a challenging problem for localizing the real position of the object geographically given a single image. Several important features have been added in the crowd-imaging interface of the full version of the DS-Crowd app, which serves to increase the positioning accuracy of the object given the geo-tag of the imaging position.
For ‘Degree of Damage/Effect’, this is a subjective process subject to individual person’s discerning process and personal judgment. However, we believe that one key merit of crowdsourcing is its auto-validating property through a statistical consensus calculation process, which yields a crowdsourcing-consensus ‘ground-truth’ estimate. This process is currently done in the cloud end given dynamically generated crowdsourcing results. To realize this crowdsourcing interface design, a sliding-bar analytics that ranges from 1 to 5 is added for selecting a (subjective) quantitative degree of damage or effect.
The last note — the CA attributes selected here are generic. Specifically needed damage attributes for specific disasters can be designed. For instances, if high winds related damage is concerned, the attribute can be actual damage signatures, such as ‘degree of loss of roof’ (ranging from 1 to 5 indicating degree of loss); if surge/flooding inundation related damage, an attribute can be Location of Water Mark.
How to use?
The DS-Crowd (light) is currently implemented using the Android Framework and currently it runs only on Android specific devices. Two user groups are designed to use this app (Figure 2a):
- Analyst: Responsible for analyzing a provided scene by identifying the type of objects, degree of damage, and marking boundaries of the damage;,
- Coordinator: Responsible for crowdsourcing management and decision-making based on the available scenes and crowdsourcing results.
The following provides brief details on different user-interface components and interactions between them. Table 1 lists the UI elements denoted in the figures.
- Main Activity: This is the screen which is displayed when the application is loaded. The activity consists of a header titled “DS-Crowd”. The options are (a) Analyst and (b) Coordinator. On Selecting Analyst will takes to Analyst List page (Figure 1a).
- Analyze Item List: The user is provided with the list of scenes. Users can switch to Co-coordinator page (Figure 2b), load more scenes from the cloud and select a scene to analyze.
- Analyze A Scene: A scene can be analyzed with the provided options and set the damage degree for each categorized object (Figure 2c).
- Co-coordinator View: All the scenes are visualized on a Map with markers representing each scene at a particular location. Selecting a marker provides more details of the crowdsourced information for the selected scene. Once more details are listed, if the user wish to analyze the scene identifying different category objects, it can be done by selecting the Analyze button.
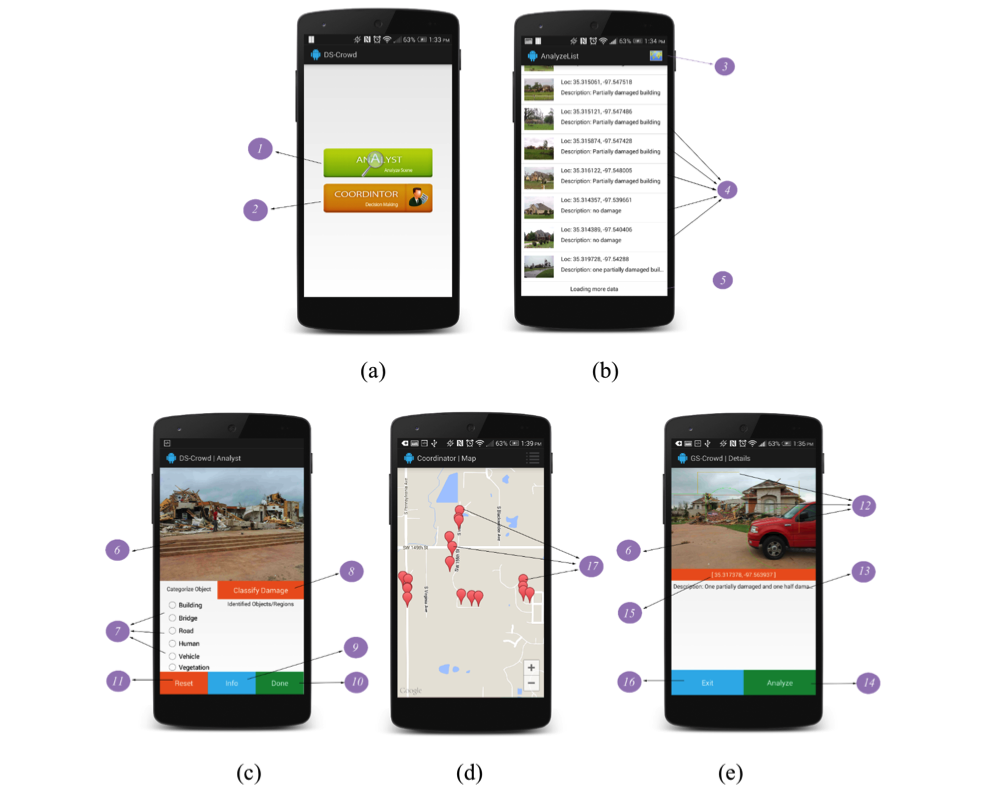
Figure 2. User interface (UI) design for the DS-Crowd application: (a) main menu; (b) list of available images; (c) crowd-analyst interface; (d) GIS marking of analyzed images; and (e) damage details from crowdsourcing with interfacing to further analysis.
Table 1. List of UI elements.
| 1 | Button to Navigate to Analyze Scene List Items |
| 2 | Button to Navigate to Co-coordinator |
| 3 | Switch to Map/List |
| 4 | Scene list items |
| 5 | Load more scenes from the cloud |
| 6 | Scene image |
| 7 | Objects to categorize |
| 8 | Button to select damage level once an object is identified |
| 9 | Provides more information about the current scene |
| 10 | Button to update the analyzed objects information to cloud. |
| 11 | Reset all the analyzed objects to null |
| 12 | Previously analyzed regions by other users |
| 13 | Description provided for the scene |
| 14 | Button to analyze the current scene |
| 15 | Location where this scene is |
| 16 | Exit the application |